Spotify Royalty Calculator
See What You Actually Earn
Most calculators show gross payout rates. We show what actually reaches your bank account and what you're missing. Calculate earnings across 100+ countries with the only tool that accounts for distributor splits and missing publishing royalties.
The Truth About Spotify Payouts: What Other Tools Won't Tell You
A stream in Iceland can be worth 100x more than one in Belarus. But even in high-paying countries, most independent artists only collect 56% of what Spotify actually pays.
What Other Calculators Show
What You Actually Receive
Most Independent Artists Miss 28% of Their Spotify Earnings
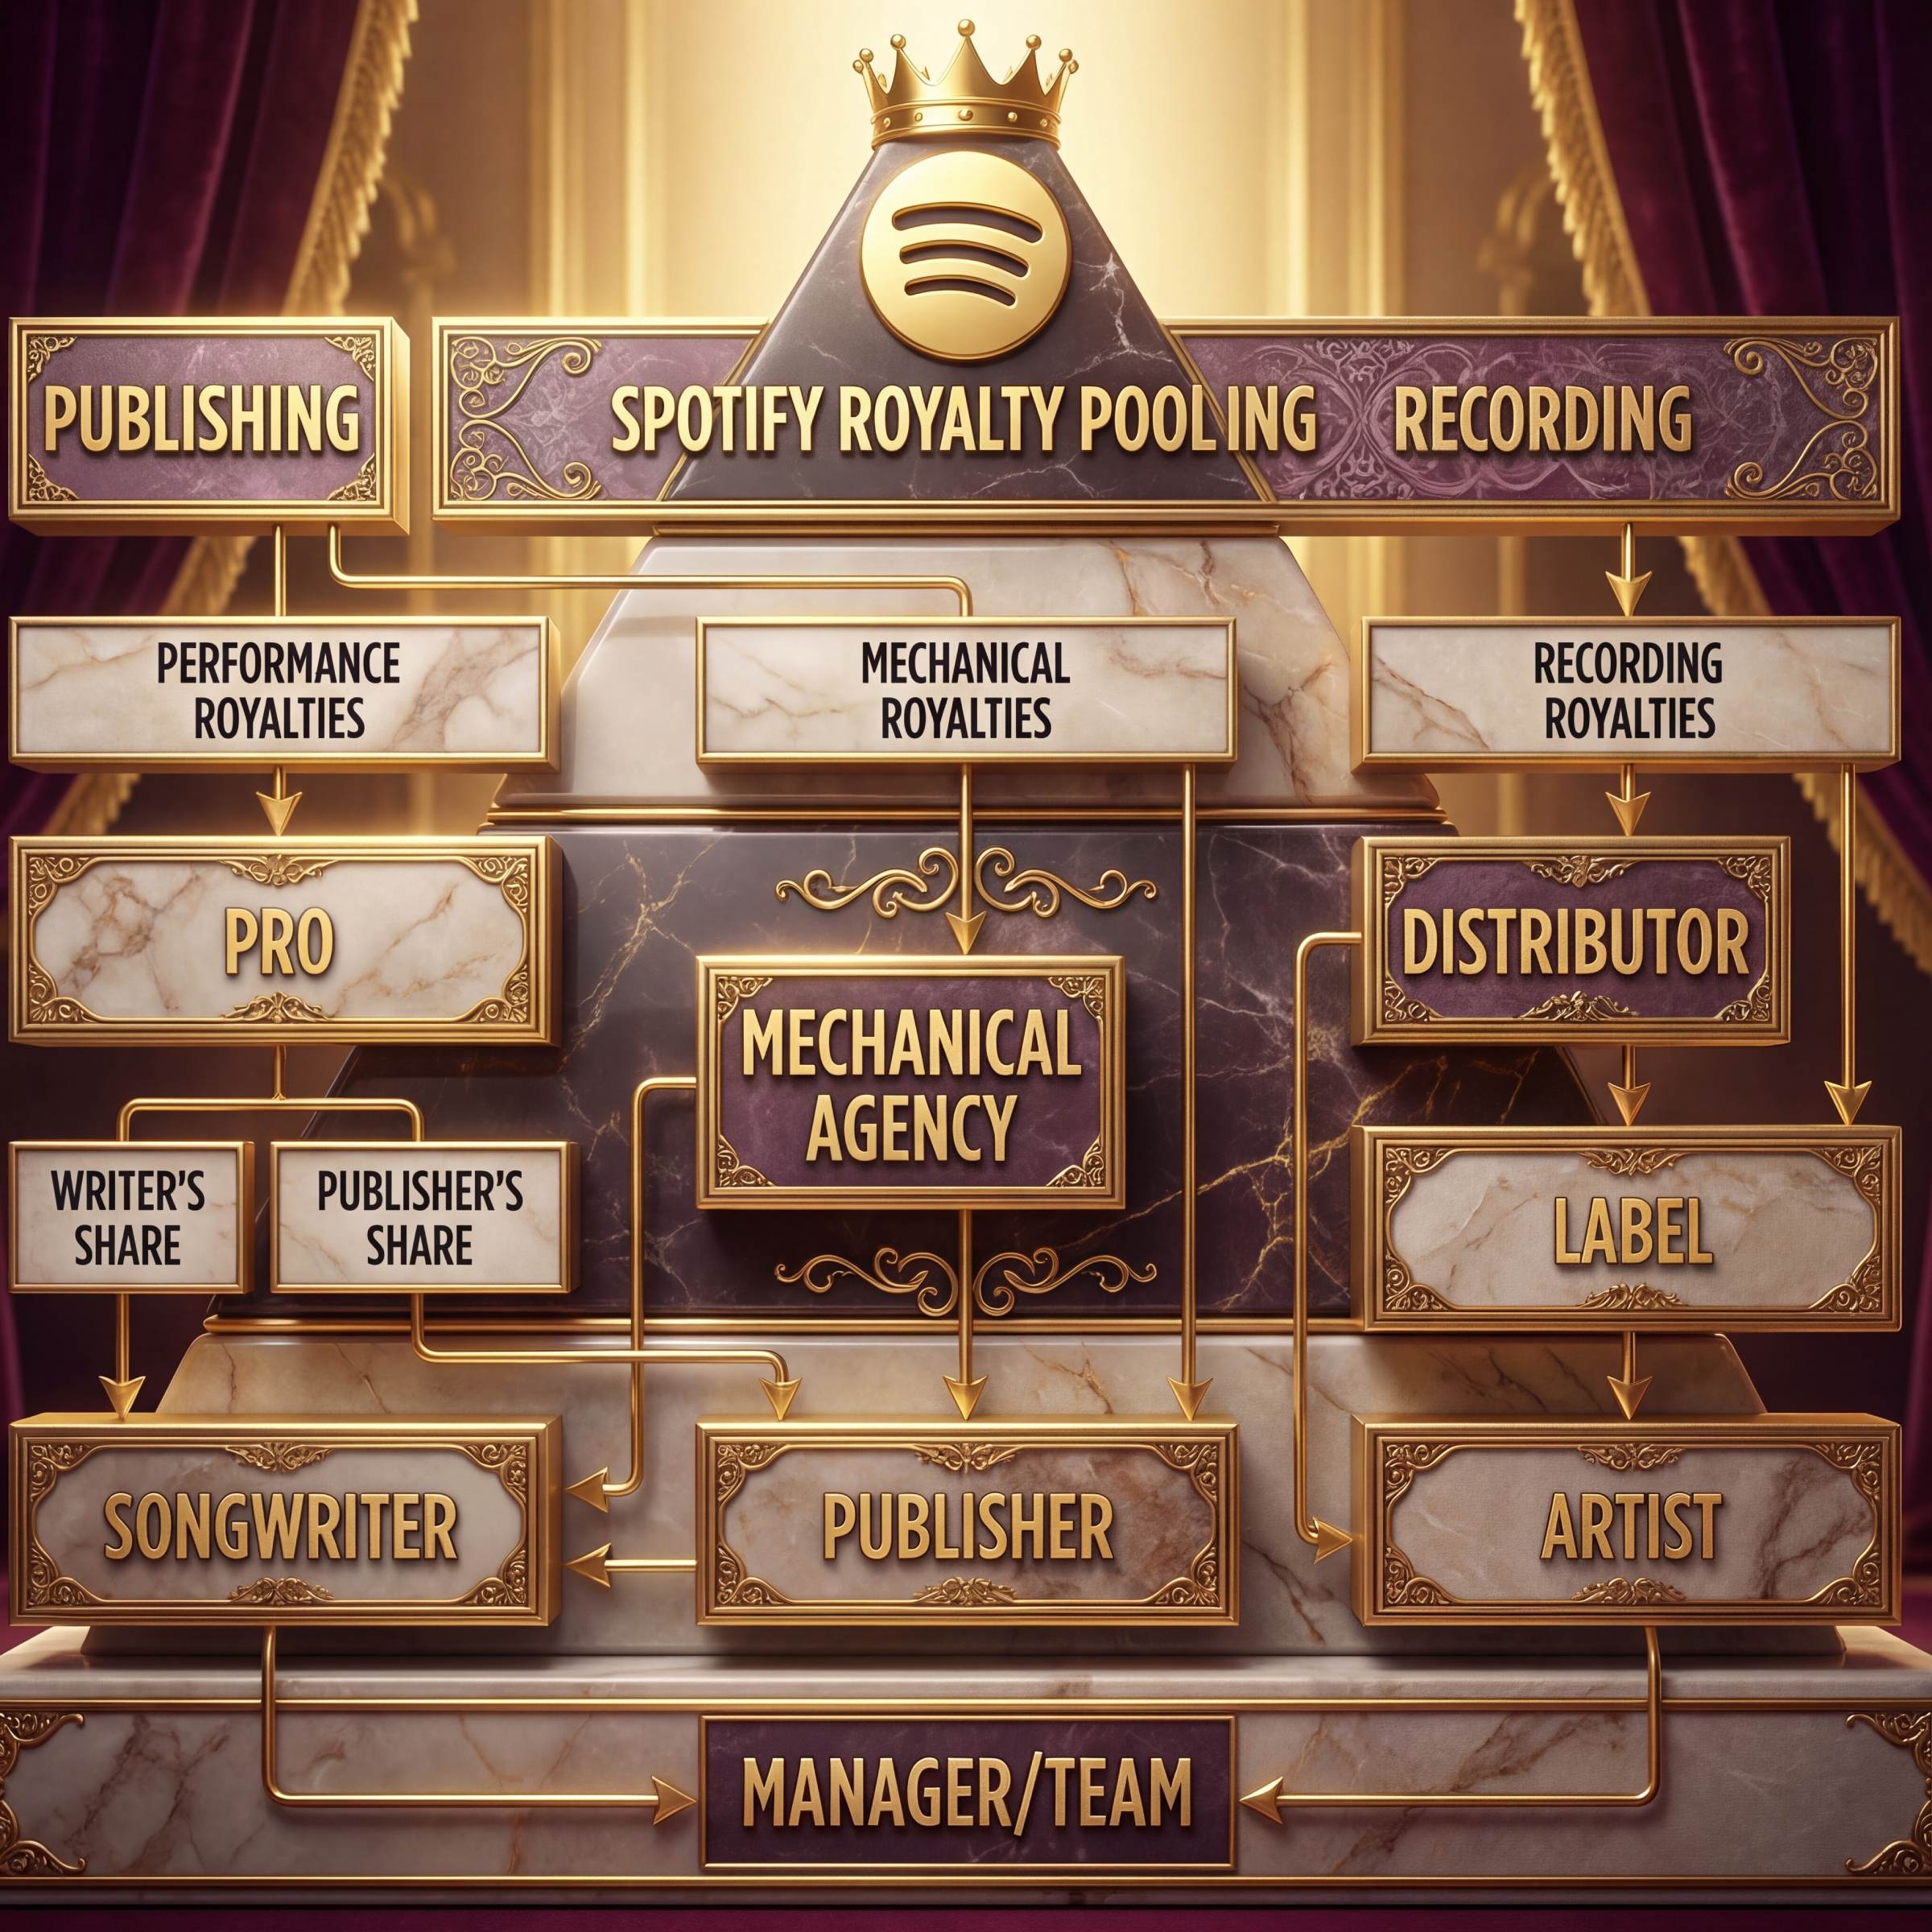
Spotify pays royalties in TWO separate streams:
1. Recording Royalties (56% of total)
What your distributor collects
- Flows through DistroKid, TuneCore, CD Baby, etc.
- This is the ONLY number most calculators show
2. Publishing Royalties (28% of total) Requires Separate Registration
Performance royalties → Your PRO (ASCAP, BMI, SESAC)
Mechanical royalties → MLC (Mechanical Licensing Collective)
⚠️ These do NOT flow through your distributor
The remaining 16% goes to Spotify and other platform costs.
How Spotify Royalties Flow to You (Or Don't)
Understanding the payment waterfall is the first step to collecting everything you're owed.
Step 1: Spotify's Revenue Pool
Spotify allocates roughly 2/3 of its revenue (from Premium subscriptions and ads) to rightsholders. This creates separate monthly pools for each country.
Step 2: The Great Split Recording vs Publishing
That pool divides into two completely separate payment streams:
- ~80% → Recording royalties (master rights)
- ~20% → Publishing royalties (composition rights)
Step 3: Recording Path Through Your Distributor
Recording royalties flow to your distributor, then to you based on your deal:
- DistroKid: You keep 100% (minus $20-35 annual fee)
- TuneCore: You keep 100% (minus $30-75 annual fee)
- CD Baby: You keep 91% ($9.95 one-time fee per release)
- Label deals: You keep 15-50% typically
Step 4: Publishing Path Separate Registration Required
Publishing royalties do NOT go through your distributor. They require:
Performance Royalties (~14% of total):
- Must register with a PRO: ASCAP, BMI, or SESAC (US)
- International: PRS (UK), SOCAN (Canada), APRA (Australia), etc.
- Registration is separate from your distributor
Mechanical Royalties (~14% of total):
- US: Must register with MLC (free, but you have to do it)
- International: Collected by mechanical agencies (varies by territory)
- Again, completely separate from your distributor
⚠️ Reality Check
If you're only using a distributor like DistroKid and haven't registered with a PRO or MLC, you're collecting ~56% of what Spotify pays. The other ~28% is sitting unclaimed or going to someone else who registered the composition.
Calculate Your Real Earnings by Country
The first calculator that shows gross payouts, distributor cuts, missing publishing royalties, and what actually hits your account.
Spotify Payout Rates by Country (2025 Data)
Real-time payout rates across 100+ countries. Remember: these are GROSS rates before your distributor split and missing publishing royalties.
| Country | Gross/Stream | Recording (80%) | Publishing (20%) | Market | Competition | Action |
|---|---|---|---|---|---|---|
| 🇳🇴Norway | $0.007200 | $0.005760 | $0.001440 | 32.73% | Low | Calculate |
| 🇩🇰Denmark | $0.006850 | $0.005480 | $0.001370 | 27.12% | Low | Calculate |
| 🇮🇸Iceland | $0.006720 | $0.005376 | $0.001344 | 26.06% | Low | Calculate |
| 🇸🇪Sweden | $0.006800 | $0.005440 | $0.001360 | 30.48% | Medium | Calculate |
| 🇫🇮Finland | $0.006400 | $0.005120 | $0.001280 | 25.00% | Low | Calculate |
| 🇳🇱Netherlands | $0.005200 | $0.004160 | $0.001040 | 23.86% | Medium | Calculate |
| 🇦🇺Australia | $0.005200 | $0.004160 | $0.001040 | 25.00% | Medium | Calculate |
| 🇩🇪Germany | $0.004400 | $0.003520 | $0.000880 | 21.43% | High | Calculate |
| 🇬🇧United Kingdom | $0.004200 | $0.003360 | $0.000840 | 23.53% | High | Calculate |
| 🇨🇦Canada | $0.004100 | $0.003280 | $0.000820 | 21.79% | Medium | Calculate |
| 🇺🇸United States | $0.003900 | $0.003120 | $0.000780 | 24.48% | Very High | Calculate |
| 🇫🇷France | $0.003800 | $0.003040 | $0.000760 | 17.65% | High | Calculate |
| 🇵🇱Poland | $0.003600 | $0.002880 | $0.000720 | 13.68% | Medium | Calculate |
| 🇪🇸Spain | $0.003500 | $0.002800 | $0.000700 | 16.25% | High | Calculate |
| 🇮🇹Italy | $0.003400 | $0.002720 | $0.000680 | 13.90% | High | Calculate |
| 🇯🇵Japan | $0.003200 | $0.002560 | $0.000640 | 8.80% | Medium | Calculate |
| 🇧🇷Brazil | $0.002800 | $0.002240 | $0.000560 | 12.96% | High | Calculate |
| 🇲🇽Mexico | $0.002500 | $0.002000 | $0.000500 | 12.31% | Medium | Calculate |
| 🇰🇷South Korea | $0.002400 | $0.001920 | $0.000480 | 8.08% | Medium | Calculate |
| 🇦🇷Argentina | $0.002200 | $0.001760 | $0.000440 | 18.48% | Medium | Calculate |
💡 Pro Tip: High per-stream rates matter, but so does market size. The US has "only" $0.0039/stream but 82M subscribers. India has $0.0012/stream but massive growth potential and low competition.
Or click any country name above for a country-specific calculator
Why Geographic Payout Strategy Matters for Your Revenue
It's not just about the per-stream rate. Market penetration, competition level, and ad revenue all affect your actual earnings.
Factor 1: Revenue Pool Disparities
Countries with higher subscription fees and stronger advertising markets generate larger royalty pools. A Premium stream from Switzerland contributes significantly more than one from a market with lower subscription costs.
Example: 1,000 Premium streams
- Switzerland: ~$7.20 gross
- Portugal: ~$1.80 gross
- 4x difference for the same effort
Factor 2: Premium vs Ad-Supported Mix
Premium subscribers generate substantially more revenue than ad-supported listeners in every country. Premium-heavy markets like Norway (95% premium saturation) are significantly more valuable than ad-heavy markets.
Example: 10,000 streams in Norway
- If 95% Premium: ~$68.40 gross
- If 50% Premium: ~$43.20 gross
- 58% revenue difference
Factor 3: Competition & Saturation
Lower competition markets mean your streams represent a larger share of the total pool. High saturation markets (85%+) have less growth potential but more stable earnings.
Market Types:
- Low competition, high saturation (Norway, Iceland): Best per-stream value, established market
- High competition, high saturation (US, UK): Lower per-stream, but massive scale
- Low competition, low saturation (India, Indonesia): Growth opportunity, lower immediate value
Factor 4: Strategic Marketing ROI
Investing $500 in ads targeting high-payout countries with existing listener traction can yield 3-6x better returns than untargeted promotion.
Case Study:
Independent artist allocated marketing budget:
- 60% to US (existing traction + high payout)
- 40% to test UK and Germany (high payout + genre fit)
- Result: 40,000+ new streams, 3,300% increase in saves, positive ROI in 6 weeks
How Spotify's Pro-Rata System Actually Works
Understanding this is crucial. Spotify doesn't pay "per stream" they pay based on your share of each country's total streams.
The Formula
× Country X's Total Revenue Pool
× ~2/3 (royalty allocation)
× 80% (if recording) or 20% (if publishing)
× Your deal terms
Worked Example
Scenario: You get 100,000 streams in Germany in March 2025
Step 1: Germany's March Revenue Pool
- Premium subscriptions: €50M
- Ad revenue: €8M
- Total: €58M
- Royalty allocation (2/3): €38.67M
Step 2: Germany's Total Streams
- All artists combined: 8.8 billion streams
- Your streams: 100,000
- Your share: 0.00114% of total
Step 3: Your Share of Recording Pool (80%)
- Recording pool: €30.94M
- Your share: €30.94M × 0.00114% = €352.71
Step 4: Your Distributor's Cut
- If DistroKid (0% cut): €352.71 to you
- If Label deal (50/50): €176.36 to you
Step 5: Publishing Royalties (If Registered)
- Publishing pool: €7.73M
- Your share: €7.73M × 0.00114% = €88.12
- Split between PRO and mechanical agency
Total Potential: €440.83 (€352.71 recording + €88.12 publishing)
At DistroKid + Registered: €440.83
At Label + Not Registered: €176.36
You'd miss: €264.47 (60% of potential!)
Why This Matters
Implication 1: More streams ≠ always more money
If everyone else in Germany also gets more streams that month, the pool divides into smaller pieces. Your 100K streams = smaller share.
Implication 2: Country revenue matters more than you think
Germany's pool is much larger than Portugal's, even though Germany's per-stream rate is only ~2x higher. Scale matters.
Implication 3: Your registration status is CRITICAL
The 20% publishing pool exists whether you claim it or not. If you don't register, someone else might claim your composition, or it sits unclaimed.
How Different Artists Use Geographic Payout Data
From bedroom producers to touring acts, understanding geographic royalties informs every level of career decision-making.
Independent Artist (0-10K Monthly Listeners)
Starting out, limited budget
Challenge:
Limited marketing budget ($300-$1,000 total). Every dollar must work harder. Trying to break out of "friends and family" audience.
How to use geographic data:
- Identify your current top 2-3 countries in Spotify for Artists
- If any are high-payout markets (US, UK, Western Europe), focus there
- Start with $500 Meta ads targeting ONE high-value country where you have 100+ existing listeners
- Track conversion: Ad spend → streams → actual payout (accounting for your deal)
Real Example:
Electronic artist, 2,400 monthly listeners:
- • Top countries: US (800), UK (320), Canada (180)
- • Spent $400 on US-targeted Instagram ads
- • Result: +2,100 US streams in 30 days
- • Earnings: $8.19 (properly registered for publishing)
- • Cost per stream: $0.19
- • Not profitable yet, but building foundation in highest-value market
Emerging Artist (10K-100K Monthly Listeners)
Growth phase, career decisions
Challenge:
Growth phase, deciding where to tour, which playlists to pitch, how to allocate growing (but still limited) budget. Career trajectory depends on smart decisions now.
How to use geographic data:
- Analyze top 5-10 countries by listener count AND payout rate
- Cross-reference with genre playlist landscapes
- Book shows in cities where you have streaming concentration
- Use geographic data when pitching playlists: "I'm seeing strong growth in UK streams (432% in 60 days)"
Real Example:
Indie rock band, 45K monthly listeners:
- • Strong streaming: UK (8.2K), Germany (6.1K), Netherlands (3.8K)
- • All three = high payout rates + strong indie scenes
- • Used streaming data to book 12-date European tour
- • Promoted shows via geo-targeted ads ($1,200 budget)
- • Result: Average 280 tickets per show, streaming 5x'd in tour cities
- • Post-tour streaming revenue: +$840/month sustained
Established Artist / Manager (100K+ Monthly)
Professional operation, catalog management
Challenge:
Managing catalog across multiple markets, optimizing label/publishing deals, deciding international expansion strategy. Significant revenue at stake.
How to use geographic data:
- Conduct quarterly analysis of revenue by territory
- Identify underperforming high-value markets (high payouts but low penetration)
- Negotiate better terms with rightsholders based on data
- Plan international collaborations to enter new high-value markets
Real Example:
Pop artist, 340K monthly listeners, managed:
- • Label deal: 70/30 split on recording
- • Publishing: Admin deal (15% to publisher)
- • Streaming across 89 countries
- • Analysis revealed: 68% of revenue from US, UK, Canada, Germany (all high-payout)
- • Minimal penetration in Australia ($0.0052/stream, 26M population)
- • Strategically released featuring Australian artist
- • Pitched to Australian playlists with "local connection" angle
- • Result: 4 editorial placements, AU listeners: 1.2K → 18K in 90 days
- • Added $2,400/month in streaming revenue from high-payout market
Essential Tools for Geographic Revenue Optimization
Layer these tools with our calculator to build a complete picture of your geographic performance and opportunities.
Free Analytics
Spotify for Artists
What it shows: Listener breakdown by country and city, real-time
Best for: Identifying where your audience already is
Cost: Free
artists.spotify.com →Apple Music for Artists
What it shows: Similar geographic data for Apple Music streams
Best for: Cross-platform strategy (Apple Music pays ~1.5x Spotify on average)
Cost: Free
artists.apple.com →Premium Analytics
Soundcharts
Best for: Identifying growth markets and playlist opportunities
Cost: $49-199/month
soundcharts.com →Viberate
Chartmetric
Best for: Identifying viral potential by region before it happens
Cost: $49-299/month
chartmetric.com →Tool Strategy by Budget
$0 Budget
- Spotify for Artists + Calculator
- Register with PRO + MLC
- Organic social in target countries
$500-2,000 Budget
- Add Soundcharts ($50/mo) for 3-month trial
- $400/mo Meta ads to ONE high-payout country
- Track with calculator to verify ROI
$10,000+ Budget
- Full analytics stack (Soundcharts, Chartmetric, Viberate)
- Multi-platform ads (Meta, Spotify, YouTube)
- Label/management should be involved at this level
How to Collect the Missing 28%: Step-by-Step Registration
These are separate from your distributor and take 15-30 minutes each. Do this once, collect forever.
Registration Path 1: Performance Royalties (PRO)
What: ~14% of your Spotify earnings (the "performance" portion of publishing)
Who Needs This: Every songwriter, producer, and artist who writes their own music
Options (US):
- ASCAP $50 one-time fee
- BMI Free for songwriters, $150 for publishers
- SESAC Invitation-only, mainly Nashville-focused
How to Register:
- Step 1: Choose your PRO (all three collect the same royalties from Spotify)
- Step 2: Register as Writer (Required) Your name as it appears on releases
- Step 3: Register as Publisher (Highly Recommended) Collect the other 50%
- Step 4: Register your songs Must match Spotify exactly
Registration Path 2: Mechanical Royalties (MLC US Only)
What: ~14% of your US Spotify earnings (the "mechanical" portion of publishing)
Who Needs This: Every songwriter, producer, and artist who writes their own music AND receives US streams
🚨 Critical Note: The MLC launched in 2021 and is sitting on $424M+ in unmatched royalties. If you've had US streams since 2021 and haven't registered, YOUR MONEY IS WAITING.
How to Register:
- Step 1: Create MLC Account (free at themlc.com)
- Step 2: Claim your songs The MLC has a database of unclaimed royalties
- Step 3: Register new releases Add songs BEFORE release
- Step 4: Configure payment Minimum threshold: $5, Monthly payments
Registration Path 3: International Mechanical Royalties
What: Mechanical royalties from non-US countries (~14% of international streaming)
Who Needs This: Anyone with international streams
Options:
Option 1: Through Your PRO (Easiest) Some PROs collect both performance AND mechanical internationally
Option 2: Mechanical Agencies by Country Different countries have different systems
Option 3: Publishing Administrator (Comprehensive) Songtrust ($100/year), Sentric (Free or commission-based), CD Baby Pro ($30-70 per release)
Recommendation by Career Stage
0-10K Monthly Listeners
- ✓ Minimum: Register with PRO + MLC (US)
- Cost: $50-100 total
- Time: 45 minutes
- Collect: ~20-25% of total royalties
10K-100K Monthly Listeners
- ✓ Required: PRO + MLC + International mechanical (via Songtrust)
- Cost: $150-200/year
- Time: 2 hours initial setup
- Collect: ~28% of total royalties (complete)
100K+ Monthly Listeners
- ✓ Required: Full publishing infrastructure
- Consider: Publishing admin deal (15% commission) or full publishing deal
- Collect: Complete 28% across all territories
- At this scale, the uncollected money is substantial enough to warrant professional help
Common Registration Mistakes (Avoid These)
Mistake 1: Registering After Release
Spotify reports streams to PROs/MLC monthly. If you register 6 months after release, you might miss those first 6 months of royalties.
Fix: Register 2-4 weeks BEFORE release date.
Mistake 2: Mismatched Metadata
If your PRO registration says "Song Name (feat. Artist)" but Spotify shows "Song Name", the systems can't match.
Fix: Match EXACTLY to Spotify same spelling, capitalization, punctuation.
Mistake 3: Wrong Writer Splits
If you register as 100% writer but your collaborator also registers as 100% writer, the PRO sees 200% split (impossible).
Fix: Agree on splits BEFORE registration. Use Split Sheet apps.
Mistake 4: Not Registering as Publisher
Many artists only register as "writer" with their PRO. Writers get 50% of performance royalties. If you don't register as publisher, the other 50% sits uncollected.
Fix: Register both writer AND publisher entities.
Mistake 5: Assuming Your Distributor Does This
DistroKid, TuneCore, CD Baby collect recording royalties ONLY. Publishing is separate. Some offer add-on services (CD Baby Pro, DistroKid Bank), but these cost extra.
Fix: Understand what your distributor does and doesn't collect.
Common Questions About Spotify Royalties & Geographic Payouts
Which countries have the highest payout rates on Spotify?+
Based on 2025 data, the highest GROSS per-stream rates are:
- Norway (~$0.0072)
- Denmark (~$0.0068)
- Iceland (~$0.0067)
- Sweden (~$0.0068)
- Finland (~$0.0064)
However, the highest TOTAL REVENUE POTENTIAL considers both rate and market size:
- United States ($0.0039/stream, but 82M subscribers)
- United Kingdom ($0.0042/stream, 16M subscribers)
- Germany ($0.0044/stream, 18M subscribers)
Strategy: Target high-rate Scandinavian countries if you have existing traction there. Target US/UK/Germany for scale and tour opportunities.
What's the difference between recording and publishing royalties?+
Recording Royalties (~56% of what Spotify pays):
- Payment for the sound recording (the master)
- Goes to: Whoever owns the master (usually artist or label)
- Flows through: Your distributor (DistroKid, TuneCore, label, etc.)
- You likely know about this one
Publishing Royalties (~28% of what Spotify pays):
- Payment for the composition (the song itself melody, lyrics, chords)
- Goes to: Songwriter(s) and publisher(s)
- Flows through: PROs (ASCAP, BMI) + Mechanical agencies (MLC)
- MANY artists don't realize this exists or requires separate registration
Critical mistake: They register with DistroKid, which collects recording royalties (56%), and assume that's everything. They never register with a PRO or MLC, so the publishing royalties (28%) sit uncollected.
How can I see how many streams I have in each country?+
Free:
- Spotify for Artists: Dashboard → Audience tab → Country breakdown
- Apple Music for Artists: Analytics → Listeners → Geography
- YouTube Studio: Analytics → Geography
Premium:
- Soundcharts: Heat maps + historical trends by country
- Chartmetric: Multi-platform geographic analysis
- Viberate: Fan density maps + growth predictions
Distributor Reports (Delayed):
Your monthly royalty statement shows actual REVENUE by territory, confirming which countries generated earnings.
Start with Spotify for Artists it's free, real-time, and sufficient for most strategic decisions.
Do Premium vs ad-supported streams affect my international earnings?+
Yes, massively. Premium streams contribute significantly more to every country's royalty pool because:
- Subscription fees > Ad revenue per user Premium: $10-15/month generates ~$6-8/month for royalty pool. Ad-supported: ~$2-4/month for royalty pool
- Different pools within each country Spotify actually maintains TWO pools per country: Premium subscriber pool (larger) and Ad-supported pool (smaller)
- Your share is calculated separately If your music skews Premium listeners, you get more of the larger pool
Real example:
- 10,000 Norway streams (95% Premium saturation): ~$68 gross
- 10,000 Brazil streams (60% Premium saturation): ~$19 gross
- 3.6x difference due to both rate AND Premium mix
Strategy implication: Target markets with high Premium saturation (Nordics: 90%+, US: 87%, UK: 85%+) over markets with low Premium penetration.
Should I focus on high-payout countries or high-volume countries?+
Tiered approach based on career stage:
Emerging (0-50K monthly listeners):
- 60% budget → High-payout countries where you have ANY existing traction
- 40% budget → Test one high-volume market with low competition
Growing (50K-500K monthly):
- 70% budget → Top 3-5 high-payout countries
- 30% budget → Strategic expansion (tour planning, collaborations)
Established (500K+ monthly):
- Sophisticated multi-market strategy
- High-payout markets for revenue maximization
- High-volume markets for cultural impact and tour economics
Why does my per-stream rate vary month to month?+
Multiple factors cause fluctuation:
- Pool Size Changes More Premium subscribers → larger pool → higher rate
- Total Stream Volume Holiday season = massive streaming increase → your share shrinks slightly
- Currency Exchange Spotify pays in local currency, converts to your payout currency
- Premium/Free Mix That Month Some months have higher Premium engagement
- Artificial Stream Detection Spotify removes bot/fake streams retroactively
Normal variance: ±5-10% month to month
Concerning variance: ±25%+ (investigate for fake streams or metadata issues)
Best practice: Don't obsess over monthly rate changes. Track 90-day rolling average instead.
How do I register for the missing publishing royalties?+
Two separate registrations required:
Registration 1: PRO (Performance Royalties)
US Options:
- ASCAP: ascap.com ($50 writer fee)
- BMI: bmi.com (Free writer, $150 publisher)
Time: 30 minutes setup, 5 minutes per song
Registration 2: Mechanical Rights
- US: MLC at themlc.com (FREE)
- International: Varies by country or use admin service like Songtrust ($100/year)
What if I'm with a label do they collect publishing?+
Usually NO.
Standard label deal:
- Label gets: Recording royalties (master rights)
- Label split: 50/50 to 85/15 (they keep 50-85%)
- Publishing: NOT included unless specifically negotiated
360 deal:
- Label might get: Recording + Publishing + Touring + Merch
- Read your contract carefully
- Publishing split often separate from recording split
Common scenario:
- Label collects: Recording (and takes their %)
- You collect: Publishing (if you register yourself)
- Result: You keep 100% of publishing even with label deal
This is why registration matters even if you have a label.
Beyond Numbers: Get Your Complete Release Strategy
This calculator shows you WHAT you're earning by country. PitchPlus shows you HOW to maximize those earnings with YOUR specific track.
You now know:
- ✅Which countries pay the most per stream
- ✅What you're actually receiving vs what Spotify pays
- ✅How much you're missing in publishing royalties
- ✅How to register to collect everything
But you still don't know:
- ❌Which countries YOUR track will resonate in most
- ❌What 30-second segment to use in ads for each market
- ❌How to pitch YOUR song to Spotify editorial for maximum acceptance
- ❌Which countries have playlists that match YOUR genre/mood
What PitchPlus Analyzes (That Calculators Can't)
1. Star Moment™ Your Track's Viral Segment
AI analyzes your audio to identify the 30-second segment with highest engagement potential. Audio analysis of hook timing, energy curve, and melodic memorability.
2. Hook & Hold™ Engagement Prediction
Predicts where listeners will drop off, skip, or save. Shows you first 30 seconds hook speed, mid-song energy sustain, and outro timing.
3. AI Editorial Pitch Data-Driven Spotify Pitching
Generates playlist pitch based on actual audio features, not guesswork. Genre classification, mood/energy levels, and similar artists algorithmic matches.
4. Country-Specific Performance Prediction
Based on genre/mood/energy, predict which countries have highest playlist acceptance likelihood, strongest engagement patterns, and best touring ROI.
Package Options
Pre-Release Package
Best for: 2-4 weeks before release
- ✓ Star Moment™ identification
- ✓ AI editorial pitch generation
- ✓ Social media clip recommendations
- ✓ Genre/mood/energy analysis
Growth & Playlisting
Best for: Release week and first 30 days
- ✓ Everything in Pre-Release
- ✓ Hook & Hold™ engagement prediction
- ✓ Playlist targeting strategy
- ✓ Curator outreach templates
Complete Intelligence
Best for: Serious releases, full campaigns
- ✓ Everything in both packages
- ✓ Extended audio analysis report
- ✓ Competitor benchmarking
- ✓ Multi-platform strategy
- ✓ Priority support
Money-back guarantee: If PitchPlus analysis doesn't provide at least 3 actionable insights you didn't already know, email us within 48 hours for full refund. No questions asked.
Start Collecting Everything You're Owed
Free Tools
Use this calculator for all your releases and explore country-specific data
Fix Missing Royalties
Register with PROs and MLC to collect the missing 28%
Get Release Intelligence
Analyze your track to target the right countries with the right strategy
Analyze Your Track →"Finally, a calculator that shows what I ACTUALLY get paid, not fantasy numbers. Found out I was missing $340 in publishing royalties across my catalog."
Independent artist, 45K monthly listeners
"Used the calculator to justify targeting UK ads instead of US. Higher payout + less competition = better ROI for my budget."
Electronic producer, 12K monthly listeners
"The registration guides saved me hours of research. Signed up with ASCAP and MLC in 20 minutes. Already seeing unclaimed royalties in my MLC account."
Singer-songwriter, 8K monthly listeners
Top Country Pages
© 2025 PitchPlus Tools. Royalty rates updated monthly from industry sources and distributor reports. Rates are estimates and actual payouts vary based on your specific distributor deal, registration status, and Spotify's pro-rata calculations. This tool is for informational purposes only and does not constitute financial advice.
PitchPlus is not affiliated with Spotify, Apple Music, or any music distributor. All trademarks belong to their respective owners.
Data Sources: Spotify for Artists public data, distributor reports, PRO payment data, MLC disclosures, industry publications.
Last Updated: November 2025